Finding out the weather forecast these days is as easy as turning on the TV or checking your phone. That wasn’t always the case, though. In the hundreds of years before television and even radio, people used more rudimentary devices to predict what the skies would bring in the coming days.
One of those tools was the barometer. Once common in aircraft, ships, and ordinary households across the world, it predicts approaching weather by measuring changes in air pressure. While technological advancements have replaced the humble barometer in meteorological circles, they’re still fun to have at home and know how to read.
In this article we offer a primer on the history of barometers, how they work, and how to use one today to predict the weather. Barometers allow you to feel more connected to the natural forces at work outside your window, and free you from being completely reliant on those oft-wrong apps and local forecasts (studies have shown that local meteorologists inflate the chances for poor weather because it garners better ratings!).
A Brief History of the Barometer

What started as an experiment in 1640 to prove the existence of natural vacuums led to the discovery of atmospheric pressure. In 1643, Evangelista Torricelli filled a long tube with mercury, closed the end, and placed it in a shallow, open cistern that also contained mercury. When the tube was opened, mercury flowed out and filled the cistern, but then stopped about a quarter of the way down the tube and didn’t continue to pour out. Something had to be pushing down on the mercury in the cistern to make it stop, and that something turned out to be the atmosphere itself, which had previously been believed to be weightless. And so the first barometer was born.

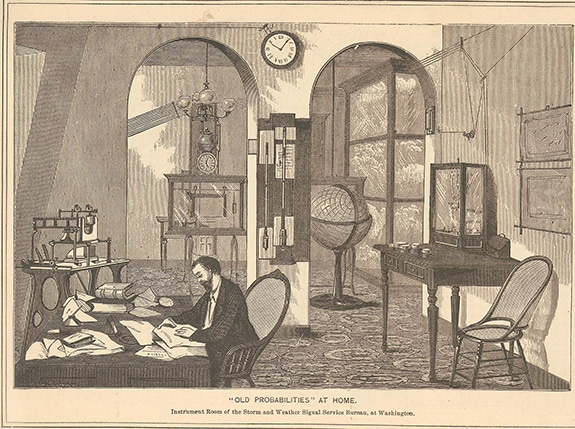
As seen on the right, looking glasses (mirrors) were often placed near barometers and thermometers, as they helped people decide what clothes they were going to put on that day!
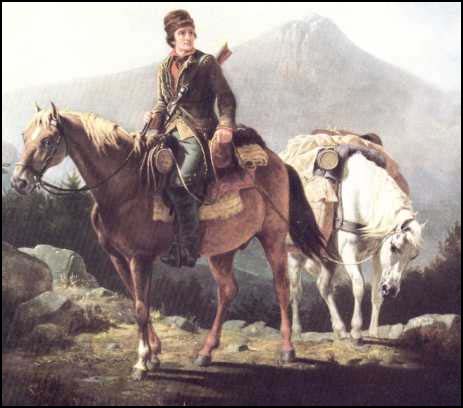
In just a couple decades, the instrument became available to well-to-do gentlemen and scientists of both the professional and amateur variety. Woodworkers in the late 17th century took great pride in fashioning elaborate housings for these new weather devices, and it became a popular sign of wealth and nobility to display a barometer in one’s home. The founders of our country were among those fond of them; both Washington and Jefferson made daily recordings of the air pressure in their journals.

In 1840, the first mechanical, non-liquid barometer was invented. It quickly took hold, not because of the concerns about mercury (like there are today), but because of the simplicity of transporting these devices. They were much smaller and therefore cheaper, as mercury barometers had to be at least 3 feet tall for the air pressure to even out the liquid pressure, which is necessary for the instrument to work. By 1900, the mercury barometer was largely replaced by these mechanical, or aneroid, versions, and barometers became more accessible for the common citizen.
Up through the 17th century, making forecasts from the data gleaned from barometers remained a very imprecise science; about all they did was predict storms when the mercury rapidly fell, and no one really understood the science of weather and atmospheric pressure yet. It wasn’t until the mid-1800s that English sea captain Admiral Fitzroy did some extensive experiments with his barometers and came up with the first detailed forecasting tables. He is now credited with starting the weather forecasting industry and he discovered the predictive significance of rising and falling barometric pressure (which we’ll get to shortly). At the same time Fitzroy was at work, meteorologists and weather hobbyists all across the world were adding to the data and the scientific understanding of how weather systems operate and move by trading letters with their fellow observers.
Once the telegraph was invented, and this swapping of information became far easier, weather forecasting really took off. Weather observations and data could now be rapidly transmitted and therefore graphed and analyzed. Forecasts slowly became more accurate, and noting how the ability to predict storms and frosts saved lives and aided commerce, agriculture, and the military, the government founded the Weather Bureau (now the National Weather Service) in 1870. Hundreds of Weather Bureau meteorological stations around the country relied on readings from barometers, thermometers, hygrometers (measuring humidity), as well as observations from the field and at sea, to offer forecasts to farmers, sailors, and ordinary citizens.
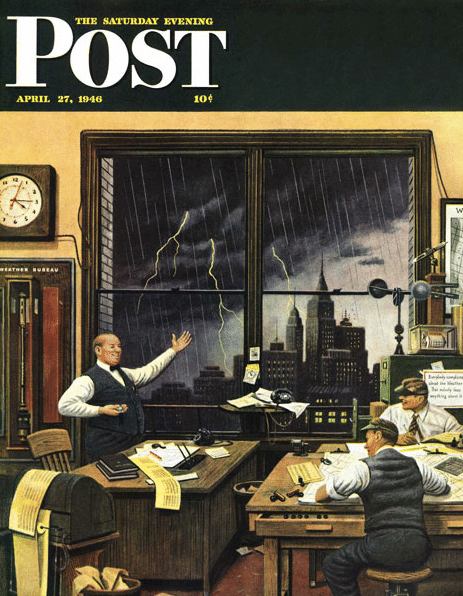
Meteorologists continued to use traditional barometers well into the mid-1900s.
It wasn’t until the mid-20th century that computers began to be used in weather forecasting, and the use of traditional monitoring tools like the barometer really declined. While pressure readings are still obviously a major part of forecasts, it’s done digitally rather than by the manual analysis of readings.
While “analog” barometers are no longer employed by professional meteorologists, knowing how to use one is a neat skill to have. And the first step towards gaining that know-how is understanding what atmospheric pressure really is.
What is Atmospheric Pressure?
Air pressure decreases as altitude increases.
Atmospheric pressure — or barometric pressure — is simply the weight of the air at ground level. It’s a little easier to understand when you think about the concept of water pressure first. As you get deeper in water, the pressure increases. This is because as you descend, the built up weight of the water on top of you increases. In 1 foot of water, you have the weight of that foot of water pressing down on you. In 2 feet of water, you have the weight of an extra foot of water pressing on you. It’s quite logical, really.
Now, think of land as being the bottom of the atmospheric ocean. As was proven by Torricelli, air is not weightless. So barometric pressure is the weight of the air from the top of atmosphere all the way down to you. Understandably, pressure is lower as you get higher in elevation — there’s less air on top of you.
Atmospheric pressure is generally measured in inches of mercury (in America, that is — it’s in millibars in metric nations), which goes back hundreds of years to Torricelli’s mercury barometer, which in basic form was still used up until the last decade or so. With the dangerous liquid now being outlawed in most places, and more modern barometers taking hold, the measurement is starting to be replaced by what’s called hectopascals. It is basically a measurement of pounds per square inch, which is more accurate to what’s actually happening with the air. Either way, on any consumer barometer you see today, your measurement will be in inches or millibars.
Now that we know what pressure is, let’s see how it affects our weather. Or more accurately, how the weather affects air pressure.
How Weather Affects Air Pressure
One of things you see most frequently in weather forecasts is big “H” and “L” signs moving across a map. These are large swaths — usually many hundreds of miles across — of high or low pressure. There’s no number which indicates high or low; it’s merely a relative term — an area of high pressure is higher than what’s around it.

An area of high pressure — i.e. more downward force — pushes air down. As the air descends, it warms, which inhibits the formation of clouds and storm systems. So high pressure is almost always a sign of good or fair weather.
Air, however, wants to rise. So once it hits an area of low pressure — where downward force isn’t as great — it will have that chance. As the air rises, it cools, which condenses and forms precipitation. Hence, low pressure is associated with poor weather (“poor” is of course a relative term — some folks really like storms and rain!).

So you can imagine a patchwork of high and low pressure swaths across a map. These are created by wind, the rotation of the planet, the sun — all kinds of factors that are completely outside of human control or prediction. But what we do know is the type of weather that these differences in air pressure portend.
A barometer that has a high reading — meaning high pressure — and is stable, indicates good weather. You’re in the midst of a high pressure system. A barometer that is falling indicates that a low pressure system is moving in, and you can expect poorer weather. How bad that weather becomes is the result of how great the difference is between the high pressure and low pressure system. The bigger the difference, the more volatility there is in the atmosphere, and the stronger the storm. The smaller the difference, the less likely you are to see rain or storms.
Alright — you know about air pressure, and how it’s affected by the weather. Now we can learn about the types of barometers, and how to actually use them to predict the weather.
Types of Barometers

Through the years, various types of barometers have been used to aid weather forecasters and seamen alike. Let’s briefly take a look at them and how they work:
Mercury: As we know, this was the first barometer invented. It utilizes an open mercury cistern along with a closed tube at least 30 inches in height. The air presses on the open mercury, which raises or lowers the level of the mercury in the tube. Because of its use of a dangerous substance, you can’t find new models on the market today. There are modern versions that have basically the same mechanism, but use neither mercury nor an open pool, but rather a fixed amount of gas enclosed in the tube. Ultimately, these aren’t as accurate as modern versions.

Aneroid: Invented in 1844, the aneroid barometer is a non-liquid device. It utilizes a small metal box — called an aneroid cell — made from an alloy of beryllium and copper. Changes in air pressure cause the box to expand or contract, which drives mechanical levers that are then displayed on the face of the barometer. These are often the beautiful devices that you imagine seeing in old ships and weather stations, and are still used today in many cases.

Electronic: As with every tool in our modern age, barometers used in modern navigation and meteorology are mostly electronic. How they work is a bit hard to understand, so I had to ask meteorologist and professor Jon Van de Grift to give it to me in the most layman way possible: “Electronic barometric sensors provide the user with an estimate of elevation above sea level. These incorporate a strain gauge, which is a thin wire that changes its electrical resistance as a result of atmospheric pressure acting on a diaphragm wrapped around it. The resulting change in voltage can be amplified and read by a converter, and eventually displayed to the user.”
Which Type Should You Buy?

To my surprise, finding a barometer was incredibly challenging. There simply aren’t many options.
The first option — and the best for the true meteorologist — is to find a digital weather station, which will likely include a barometer, as well as other readings like temperature and humidity. You can sometimes get these at big box stores, sporting goods stores, and even nurseries/floral shops, but you are likely to be limited to just 1 or 2 models to choose from. Your better bet is buying one online, like this one. It has a sensor that you hang outside which then sends measurements to a digital reader.
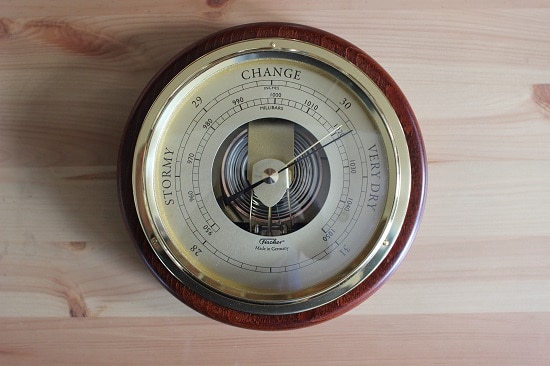
The other option, besides buying an antique, is to get a handsome looking aneroid barometer from an online retailer. I looked all over town for one, and couldn’t get my hands on anything. And that’s in Denver — it’s not like it’s a small town. I ended up getting this model from Fischer. Aneroid barometers work really well, and look darn good on a wall as a manly decoration piece. It doesn’t matter if they’re inside or outside, but know that some things will affect readings, such as proximity to heating or cooling vents, as well as use of air conditioners or humidifiers.
How to Use a Barometer to Forecast the Weather

Now that you know the science, being able to forecast the weather is actually rather simple. And while there are some differences in using an aneroid or digital barometer, the principles in measuring and analyzing pressure are the same.

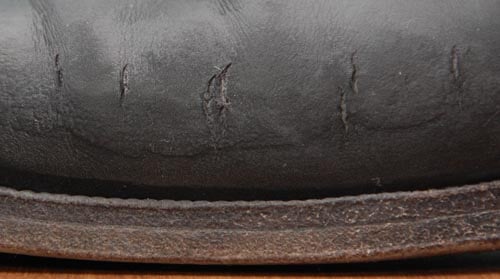
The back of an aneroid barometer. The holes at the top of plastic backing allow for air to flow through. The small screw on the bottom right edge is what’s used to calibrate the device; I had to use a small eyeglass screwdriver to do so.
Setting up your barometer is easy. For an aneroid version, you need to manually calibrate it. All this means is using a small screwdriver to set the hand (like on a clock) to match the current barometric pressure in your location (I use weather.gov). Once you’ve done that, it’s all set.
Digital barometers — usually included as part of a more comprehensive amateur weather station — do that part for you.
As we already learned, barometer measurements will either be in inches or millibars. Readings will generally be between 28 and 31 inches, usually measured to the hundredth decimal. Knowing just the number itself, however, isn’t all that helpful. What matters is in which direction the needle is moving. It’s the change in barometric pressure that helps forecast the weather. This means that static numbers with no indication of rising or falling aren’t generally very useful.
So, to get accurate predictions, you need to take a look at the barometer every few hours and see how the number is changing. Keep in mind that changes will seem miniscule; in the few weeks I’ve had my barometer it’s been between 30.00 and 30.30 the entire time, usually only moving .05-.1 in either direction on any given day.
On an aneroid barometer, you’ll have two hands. One will show the barometric pressure reading, and the other is a manual dial that you align to the pressure reading whenever you take a measurement. The purpose of the manual hand is so that you can quickly and easily see which direction the needle has moved, and how far, between readings:

Adjust the dial on an aneroid barometer whenever you take a reading to align the manual hand with the measurement hand.
Then, next time you take a reading, you can quickly see which direction the measurement needle has moved. The current reading here is about 30.18 inches.

Aneroid barometers also usually have layman’s terms like “Stormy” and “Dry” on them. The idea is that barometer readings at certain levels will portend those weather conditions. Unfortunately, those terms really only work at sea level. Here in Denver — a mile above sea level — they’re nearly worthless. No matter to me — they add to the decorative appeal of the barometer.
On a digital barometer, you’ll most likely have indications of “rising” or “falling,” and perhaps even a graph — called a barograph — showing previous readings and trends. This will be more helpful and accurate for the true amateur meteorologist. Rather than having to chart or remember previous readings, the device does it for you.
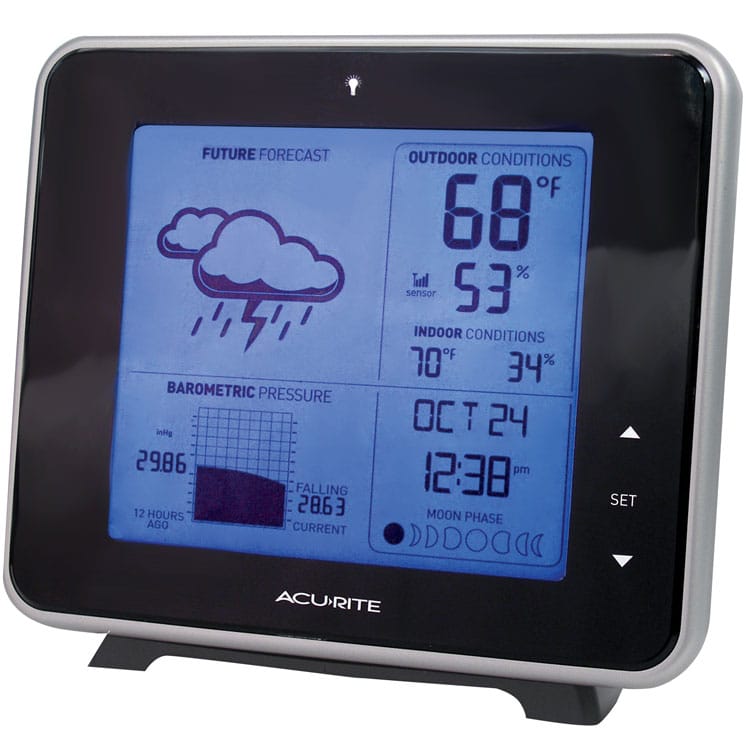
You can see the barometer reading in the lower left corner of this digital weather station. It includes a graph — called a barograph — which shows trends and movements in pressure.
Below is a basic chart which shows barometer readings and their correlated weather patterns to help you get started. Keep in mind that every location is different, and that a number of things impact a barometric reading, including temperature, elevation, humidity, etc. In an atmospherically volatile location like Denver — with the mountains rapidly affecting weather systems — some storms form too quickly to be picked up on. That’s just the nature of weather! Also keep in mind that barometers will only help you forecast for the next 24-48 hours or so. Since pressure systems last days and sometimes weeks, it can be a while before you notice any substantial difference in your readings.

These are readings for sea level. You can use this calculator to adjust for your elevation. In my experience, rather than the numbers themselves, the rising and falling trends are more important. You’ll come to find the how and low points of the atmospheric pressure in your area, and soon be able to not rely on the chart.
After a few weeks of taking readings, you’ll come to know your local weather pretty well, and you’ll be able to determine what’s high, what’s low, what’s surprising, etc. Get out there and get forecasting!